News
Latest Lion Aid News
Tanzania Non - Detriment Report presented to CITES is highly detrimental! - Part Two
Wednesday 27th April 2011
|
Click here to read Part One of this important blog!
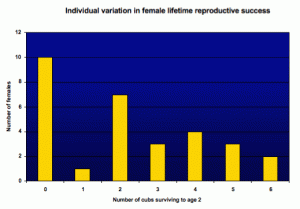
To calculate the number of adult male lions entering a population annually I used this formula: Nm = (F) x (R) Where Nm is the total number of adult males expected to be recruited into the population; F is the total reproductive output per year per female based on the above graph, divided by 2 as females produce male and female cubs; R is the ratio of adult males in the population based on actual observations. Thus, as an actual example from Tanzania:
Chardonnet (2002) estimated a total number of about 14,217 lions in Tanzania. Assuming an equal distribution based on land area, 1/3 of those lions are in protected areas and 2/3 in areas where trophy hunting is permitted, thus 9,525 total lions in the hunting areas. Assuming a reasonable estimate that 35% of the total population is reproducing females, this comes to 3334 total for the hunting areas. From the above information, 33% of those females will not leave surviving offspring, 3.3% will produce 1 cub surviving to age 2 during their reproductive life, 23.3% will produce 2 such cubs, 10% will produce 3 cubs, 13.3% will produce 4 cubs, 10% will produce 5 cubs, and 6.6% will produce 6 cubs.
With those ratios from a protected area in Botswana, 2234 females producing offspring that reach age 2 will bear a total of 7501 cubs over their reproductive life. Half of those will be female, so 3,751 male cubs will be produced over an average 8-year reproductive lifespan of a female lion (beginning age 4 and ending age 12), or 469 male cubs aged 2 produced per year.
The ratio of adult males (6 years old) in a population is taken here to be 15% based on actual observations from a variety of studies in South Africa, Botswana, Zimbabwe and Tanzania. This represents a realistic mortality rate of male lions between the age of 2 and 6. Therefore, in this example, the total number of adult males entering the population each year based on a total number of 3334 adult females in hunting concessions is 70.3.
Several assumptions have been made to derive this formula, and it might not be feasible to extrapolate lion cub survival rates and lifetime female output of cubs surviving to age 2 from Botswana to Tanzania. Survival rates could be higher or lower, and the percentage of males surviving to adulthood equally so. Nevertheless, this is the first time actual biological data has been incorporated into a prediction of the number of adult male lions entering a population on a yearly basis.
This would imply that Tanzania’s average quota (2005-2009) of 512 adult male lions over all hunting concessions exceeds recruitment by a factor of 7.3, and the average harvest exceeds adult male recruitment by a factor of 2.3. It is therefore not surprising that trophy hunters are shooting younger and younger males (sometimes those age 2) to make up the shortfall. In addition, harvest at those levels will result in a total collapse of lion populations in hunting areas. This has already been apparent in hunting concessions around Hwange National Park in Zimbabwe, and where hunting operators increasingly rely on shooting lions lured from the national park, or indeed trespass on the national park to ensure a supply of adult males for clients. Such trespass on protected areas is also increasingly thought to be occurring in Tanzania due to lax standards and corruption. Table 1. Quota and harvest rates based on annual adult male lion (=trophy lions) recruitment rates for lion populations of different sizes. Tanzania lion quota and harvest per year, % quota based on male recruitment rate of 81 per year (16,800 total lions in the country - Mesochina et al, 2010); 70 per year (14,432 lions – Chardonnet 2002) and 34 per year (7073 lions, Bauer and van der Merwe, 2004) – a,b and c. Followed by % harvest based on these recruitment rates based on total lion populations – d,e,f. Bottom line – bold figures are total quota and harvest summed over 5 years, bold italic figures are averages of percentages.
Note – Based on available lion numbers from 3 different sources, and estimations of annual adult male recruitment, quotas are set 6 to 15 times too high for recruitment to match proposed offtake by the Tanzania Government, and from 2 to 5 times too high for actual offtake levels. In fact, quota levels set by the Government approach estimated yearly numbers of 2-year old males recruited to the lion population in hunting areas, and the annual offtake reflects this by the number of male lions shot that are clearly underage. Nevertheless, these numbers clearly show that Tanzania is by far overhunting lion populations in hunting concessions, as a minimum requirement is that recruitment rate = offtake to be in any way sustainable. Given the complexities of lion society (infanticide by males taking over prides, for example), we would predict a total collapse of lion populations in hunting areas if this has not happened already. Note also that Tanzania wildlife authorities continue to award extremely high quotas despite an actual harvest of about 31% overall and 24% over the last three years. Tags: lions, Tanzania, Non Detriment Report Categories: Trophy Hunting, Politics and Wildlife |
Add a comment | Posted by Pieter Kat at 14:49


